- 下載點: http://www.yourkit.com/download/
- 可以用10 minutes emial產生一個暫時的email進行YourKit的試用
- Launch your eclipse and YourKit.
- Run your code.
- Your will see your eclipse and running process on YourKit.

Step 2: Capture Memory Snapshot
- Click Capture Memory Snapshot to see memory usage in detail.
- Launch your eclipse and YourKit.

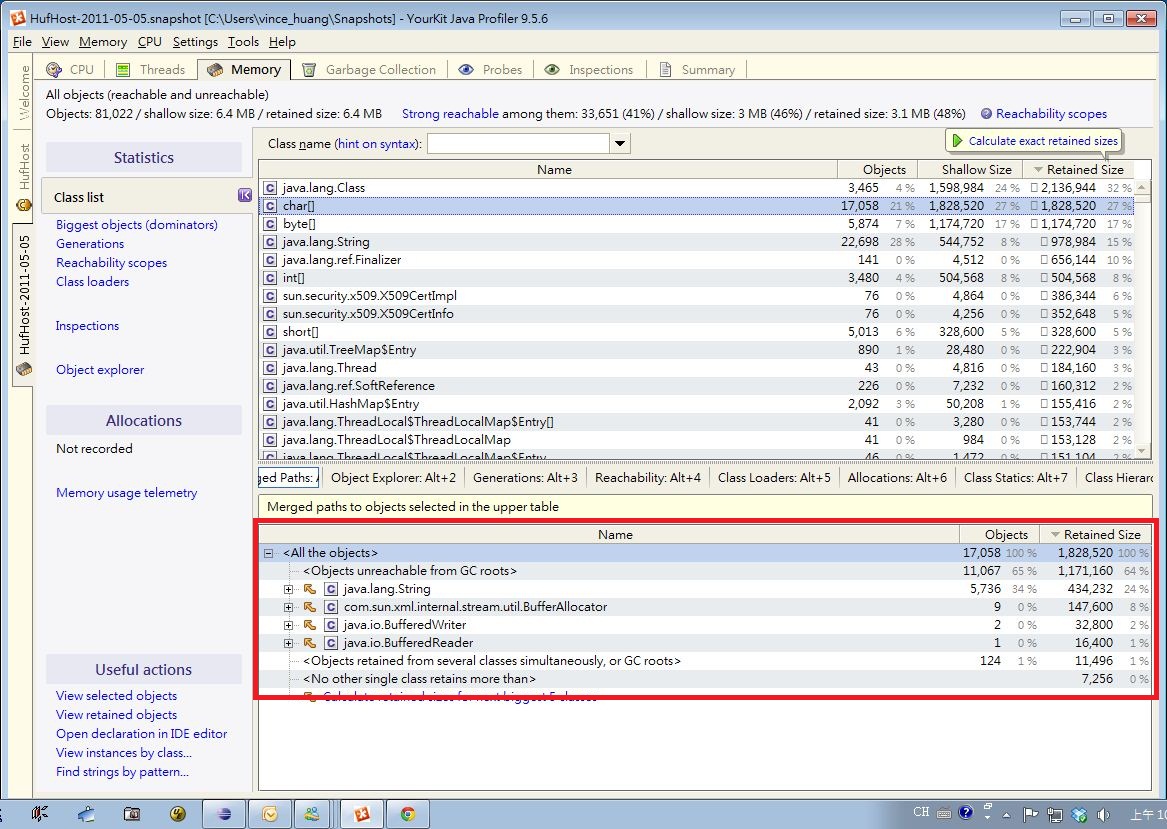
Step 3: Memory Statistics
- You will see memory statistics.
- For example, if you want to see who use char[], we can click "Click to start calculation"

Step 4: Do Memory Calculation
- You can see who use this object (ex: char[]).
Step 5: Object Explore
- You can use "Object Explore" to see data in memory.

Step 6: Paths of GC roots
- In Memory Statistics, right click class (ex: char[])
- Click "Paths of GC roots", you can see the GC status of this object.
沒有留言:
張貼留言